Ant Surrage works as a Technical Development Specialist for uni. In this article he explains how collecting and visualising crop level and crop walk data can be helpful with the optimisation of an IPM programme.
Integrated pest management (IPM) is now becoming a mainstay of crop protection. However, although our pest management practices are integrated rarely are our datasets. I regularly see growers have several different spreadsheets collecting and storing metrics. To truly unlock the potential of that data it needs to be centralised on a platform and visualised in a way that creates new actionable insights to optimize IPM performance.
There is great value to collecting many different data sets but the two most important from my experience with growers has been microclimate crop level data and detailed crop walk data.
The crop level data gives us a more valid metric to base decisions on. The environment within the canopy or on the underside of the leaf can be profoundly different from the surrounding growing environment. This is also measuring and monitoring the areas where pest and disease will develop. This intern means that any decision support dashboards created will be more representative of the crop and lead to better decision making.
Secondly, crop walk data is hugely important as it gives a historic perspective that allows for further refinement and specification of an IPM programme. It is useful for the team crop walking to have an agreed protocol and a mutual understanding of how to score pest and disease pressure. We often see growers score on a scale of 0 – 5, where 0 is no presence and 5 is a severe infection. Ensuring that everyone is scoring a 3 is crucial to make sure data sets are reliable.
Using 30MHz’s data platform and the manual data input function allows us to overlay, in widgets, pest and disease pressure against key environmental metrics such as temperature and humidity. Working with grower groups over the last two years we have been collecting the data and looking for patterns in conditions that may explain the pest and disease increases. Using these widgets and Growing Degree Hours/Growing Degree Days functions we have been able to support growers in improving the timing of their applications of biocontrol and biopesticides.
Understanding and visualising high-risk conditions for disease development has meant that growers have been able to adjust their cultural practices such as spacing, screening and venting. This reduces the risk of disease and can push infection back, which can save on applications of controls measures, saving money but perhaps as importantly in the current approval climate maintain the number of applications for key chemical controls.
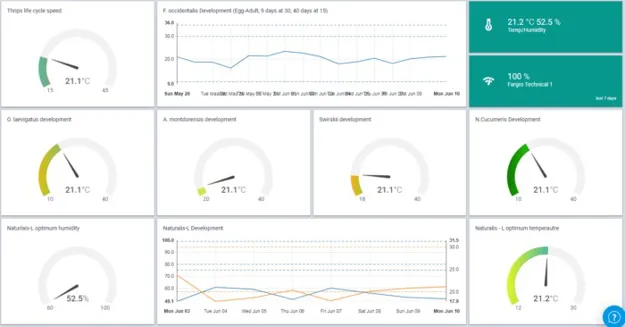
Ant Surrage shows his dashboard. (Click for here the enlarged image)
Data can be visualised via the widgets in the platform to recommend in real-time what IPM control measures will work most effectively. The best example of this is biopesticides. Biopesticides tend to be based on living organisms and as such have adapted to inhabit certain environmental conditions. Environmental data can be presented in a way that lets a grower know if the temperatures and/or humidity are correct for an efficacious application. Taking this into account growers and advisors alike can have confidence that the environmental conditions will not be a limiting factor in the efficacy of that IPM input.
To summarise, collecting, centralising and visualising crop level environmental and crop walk data can allow for the optimisation of an IPM programme at every level from cultural and hygiene measures to the application of biopesticides.
For more information: 30MHz
30MHz
Moezelhavenweg 9
1043AM Amsterdam
The Netherlands
T: +31 (0) 6 14551362
contact@30mhz.com
www.30mhz.com