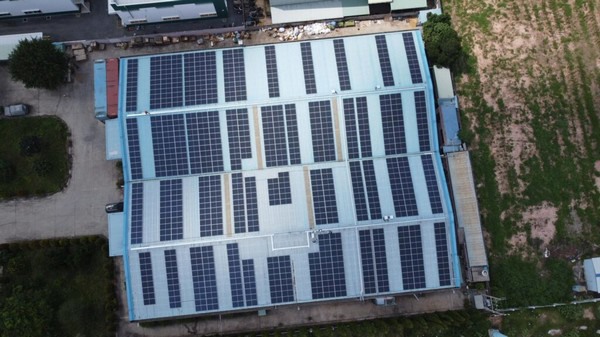
For ecoligo, climate protection has been mission goal number one from the very beginning and still is today. They aim to actively contribute to the avoidance of CO2 emissions with, for instance, solar projects. In this article, ecoligo describes how they calculate their solar impact.
The calculation of CO2 savings is based on several parameters. Once these have been determined for a solar installation, the actual calculations can follow.
Size of the solar system [MWp]: The size or capacity of the solar system is individually adapted to the needs of each customer. The size of the solar system is specified in megawatt peak (MWp) or kilowatt peak (kWp). The “peak” here stands for the peak or maximum power. The size of a solar system is calculated by multiplying the number of solar modules by the individual capacity of the solar modules used. A possible feed-in of the solar energy into the power grid, as is possible in Vietnam or Chile, is also taken into account in the size calculation for the solar system.

Solar utilization rate [%]: The solar utilization rate describes the proportion of the total solar electricity produced that is actually purchased and consumed. Since the feed-in of surplus electricity is prohibited by law in some project countries, the utilization rate here may be lower than in countries where customers can feed the surplus electricity into the grid. On average, the utilization rate in our project countries is 88%.
Specific annual energy yield [MWh/MWp/a]: This value, which looks complicated at first glance, defines the amount of energy that a solar system produces per installed MWp per year. This yield can vary depending on the strength of the solar radiation, the orientation of the solar system, and its age. To calculate the CO2 savings of a plant, we use the specific annual energy amount calculated in the system report before the plant is built.
Lifetime of the solar system [a]: We assume a duration of 25 years for all our solar systems. Originally, we had set a term of only 20 years. However, experiences with solar systems from all over the world show that the lifetime is at least 25 years. Accordingly, we have adjusted our calculations but intend to remain conservative and not go beyond the minimum term of 25 years. This term is always independent of our contract term with customers.
Rate of solar system wear [%]: The attrition rate describes the percentage loss of power generation capacity that a solar system is subject to per year. For our calculations, we assume an attrition rate of 0.6% per year, which means that the output of the solar system decreases by about 0.6% per year over its entire lifetime. This rate, which is based on the maximum annual wear rate guaranteed by the manufacturers of the solar modules used, allows us to make our calculations as realistic and at the same time conservative as possible.
CO2 emission factor[t CO2/MWh ]: The CO2 emission factor describes how much CO2 was produced in the generation of one megawatt-hour of electricity from the freely available power grid. This factor varies from country to country and is influenced by the country’s electricity mix. The larger the share of grid electricity from renewable sources, the lower the factor. As an example, Germany’s CO2 emission factor in 2020 was 0.366 t CO2/MWh, while Vietnam’s was 0.599.
Once all of these six baseline parameters have been determined for a solar project, the CO2 savings of the solar installation can be calculated, as well as the CO2 savings achieved relative to a determined amount of investment in the project.
For more information: ecoligo
ecoligo.com
