A number of new features in the digital cultivation logbook Log & Solve required a technology update. Simultaneously, the look and feel of the program were improved. As of January, most users switched to the new environment.
Although the working method did not change, the user experience improved. New features, such as the Data Explorer, make tracking crop data even more valuable. The Data Explorer allows users to compare collected data and arrive at new insights.
"Data collection is commonplace for growers and cultivators. Tracking cultivation results is done in a variety of ways. These include functions for creating protocols, reports, trial monitoring, and securing cultivation knowledge," says Gerard Flinterman of Log & Solve. "The Log & Solve cultivation dashboard makes the results transparent and translates the data into functional information, for now, and in the future."
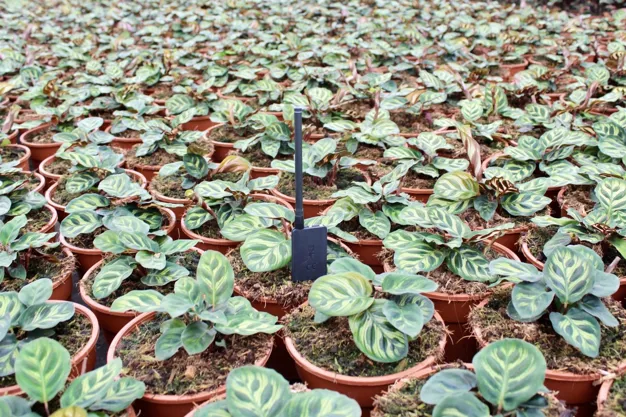 In this picture, the crop of Forever Plants where sensor measurements are made visible in the Log & Solve dashboard. This is where the translation from data to information takes place.
Get(s) even more information from data
The improved interface brings more overview to the crop data. Thereby, measurements from linked sensors are automatically updated. The Data Explorer extracts even more information from the collected data by interpreting the data in relation to the desired period. Comparisons can be made with the same cultivation period last year but also with the same cultivation phase in another season. Flinterman: "This way, you can secure knowledge and information but also transfer it. In addition, the dashboard provides an interpretation of the data and gives options for creating even better cultivation conditions for a more optimal result."
For more information: Log&Solve
log.solve@klasmann-deilmann.com
www.logandsolve.com